Jeff Berardelli is WFLA's Chief Meteorologist and Climate Specialist
TAMPA, Fla. (WFLA) — Meteorologists were astonished by last year's unprecedented sea surface temperatures in the North Atlantic. And yet, they are even more deviant right now, especially in the main hurricane development region of the Tropical Atlantic.
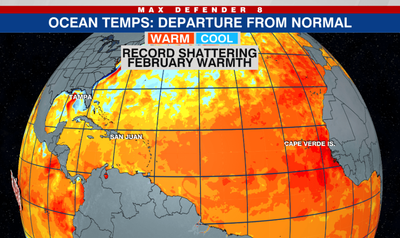
As of mid-February, average sea surface temperatures in the vast North Atlantic Basin are running about 2 degrees Fahrenheit above the 1990-2020 normal and almost 3 degrees Fahrenheit above the 1980s.
That may not sound like a lot, but consider this is averaged over the majority of the basin shown in the red outline in the image above. A deviation like that is unheard of -- until now.
To put it into more relatable terms, considering what's been normal for the most recent 30 years, the statistical chance that any February day would be as warm as it is right now is 1-in-280,000. That's not a typo. This is according to University of Miami Researcher Brian McNoldy. You can see what statisticians call the standard deviation in his graph below.
That 1-in-280,000 is compared to a recent climate, which had already been warmed substantially by climate change. If you tried to compare it to a climate considered normal around the year 1900, the math would become nonsensical -- meaning an occurrence like this simply would not be possible.
This is a window into how far, and how fast, humanity has forced the climate out of normal bounds, and into the abnormal, in a very short time. Greenhouse gases from the burning of fossil fuels are trapping excess heat in the climate system, of which 90% eventually ends up being stored in the oceans.
While human-caused climate change can't explain all of the North Atlantic warming spike this past year, it has raised the baseline climate temperature enough to more easily allow for these extremes.
One other related factor is the reduction in pollution above the North Atlantic since the 1980s due to the Clean Air Act. Up until that point, the air pollution was masking some of the heating from greenhouse gases. But as the skies cleared, ocean temperature began to warm due to less of the sun's light being reflected to space by pollutants and less cloud cover associated with it.
The graph below shows the North Atlantic temperature trend for every January since 1940 until 2024. The warming trend is clear, especially since the 1990s. And this February jumps right off the page.
But the warming of the Atlantic Ocean is not just symbolic, it has real-world consequences, and we have been seeing that over the past couple of decades with juiced-up hurricane seasons. Warm water provides more fuel for developing tropical storms and more intense hurricanes.
So it is instructive to compare water temperatures in the Tropical Atlantic Ocean with previous years that ended up having active hurricane seasons.
In the image below, we compare February sea surface temperatures with 2005, 2010, 2020, and 2024. The number of named storms each year is on the right side of the maps. This vividly illustrates not just that February 2024 is warmer than in other years, but it's in a league of its own.
So what does this mean for hurricane season? Well, it is too early to know with great certainty, partially because the water temperatures may moderate before the season, but warm February sea surface temperatures do often correlate with active hurricane seasons.
With that in mind and given we are expecting a transition to La Niña in the Pacific, all signs are pointing to a busy hurricane season in the Atlantic -- perhaps even a hyperactive one. Only time will tell, but we do have some guidance to help us.
Thanks to Tropical Tidbits, you can see the long-range forecast for July, August, and September from the North American Multi-Model Ensemble, which is a seasonal forecasting system that consists of multiple forecast models from North American modeling centers.
The first image shows forecast water temperatures. What jumps out is the below-normal water (blue strip) in the tropical Pacific Ocean. That is the signal for a robust La Niña, which correlates to active Atlantic Hurricane seasons because it reduces wind shear. Also, notice tropical Atlantic Ocean stays very warm (orange) on the model, providing high-octane fuel for storms.
Taking it one step further, we can look at rainfall anomalies in the Atlantic, which show the forecast departure from normal for rainfall in July, August, and September. You can see a wide strip of green emanating from Africa and the deep tropical Atlantic, pointed west-northwest into the Caribbean.
While this does not show tropical storms and hurricanes directly, if the models are right, it shows us that there will be an excess of thunderstorms across that swath. With warm water and low wind shear in the Atlantic, it's reasonable to assume there will be a better chance for storms to organize and intensify.
And unlike last year, the storm track portrayed by the models -- visualized by the green swath -- is towards the Caribbean. Last year, it showed a clear signal for storms to recurve out into the open Atlantic. So that's an ominous sign for 2024.
To summarize, all signs point to an active hurricane season. In fact, it's hard to get away from the conclusion that it may very well be a hyperactive season.
What we have working in our favor is that there is a lot of time for things to change -- perhaps La Niña won't form or the Atlantic will cool. Those are not out of the realm of possibilities, but at least we have plenty of time to prepare.